
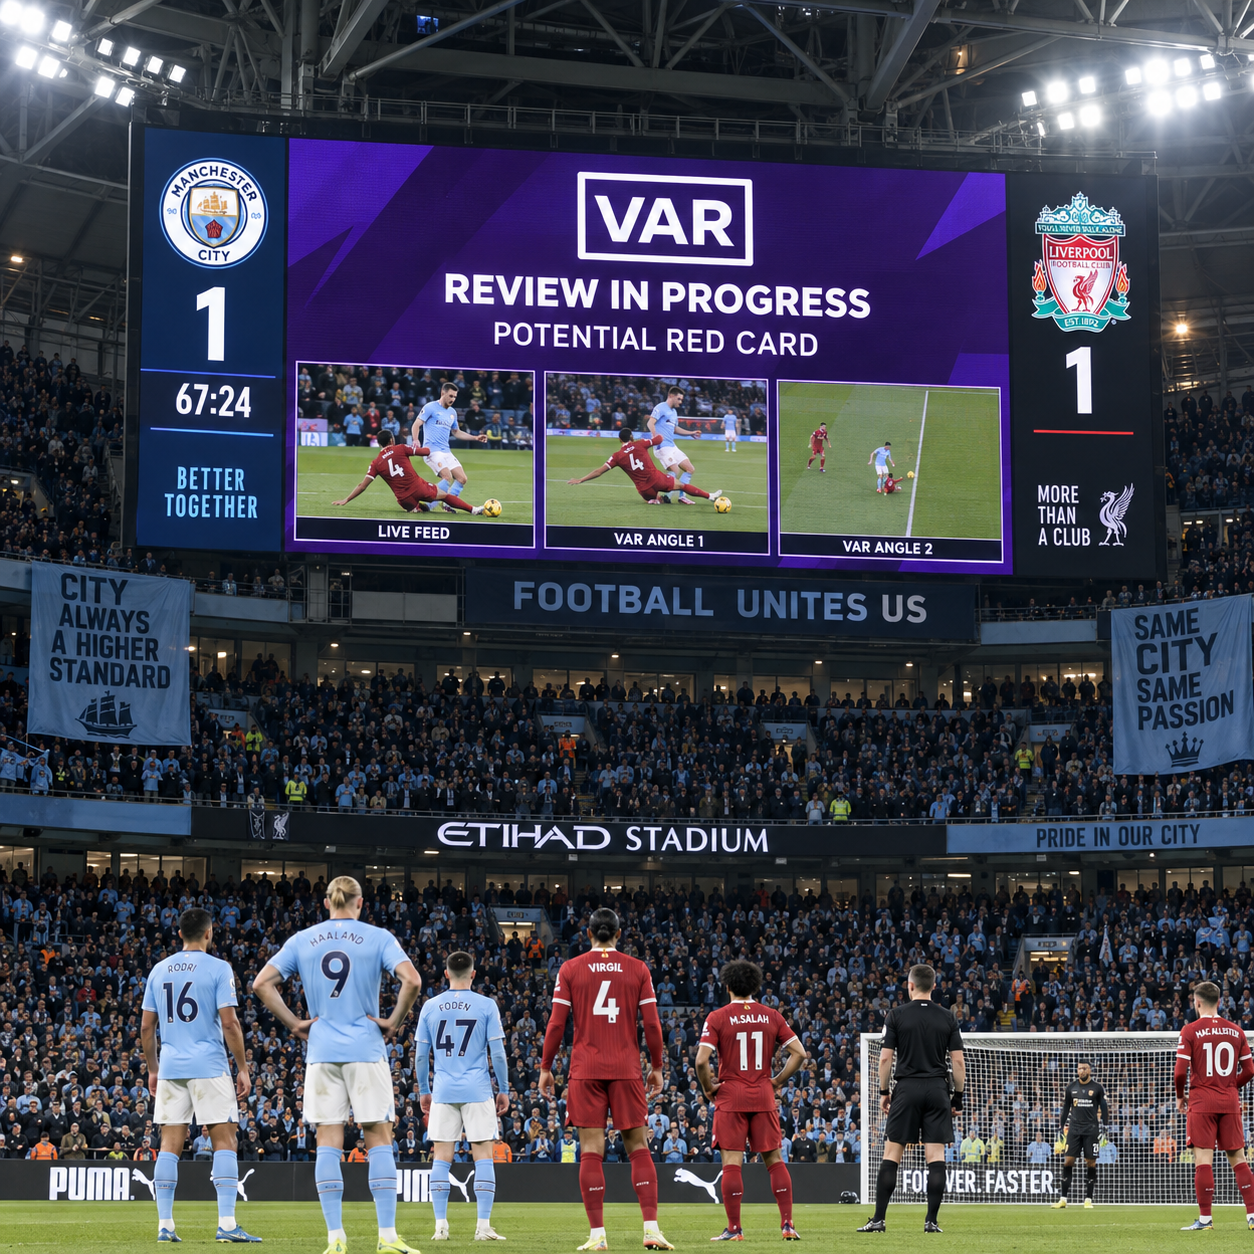
Understanding Advanced Sports Statistics Beyond the Scoreline
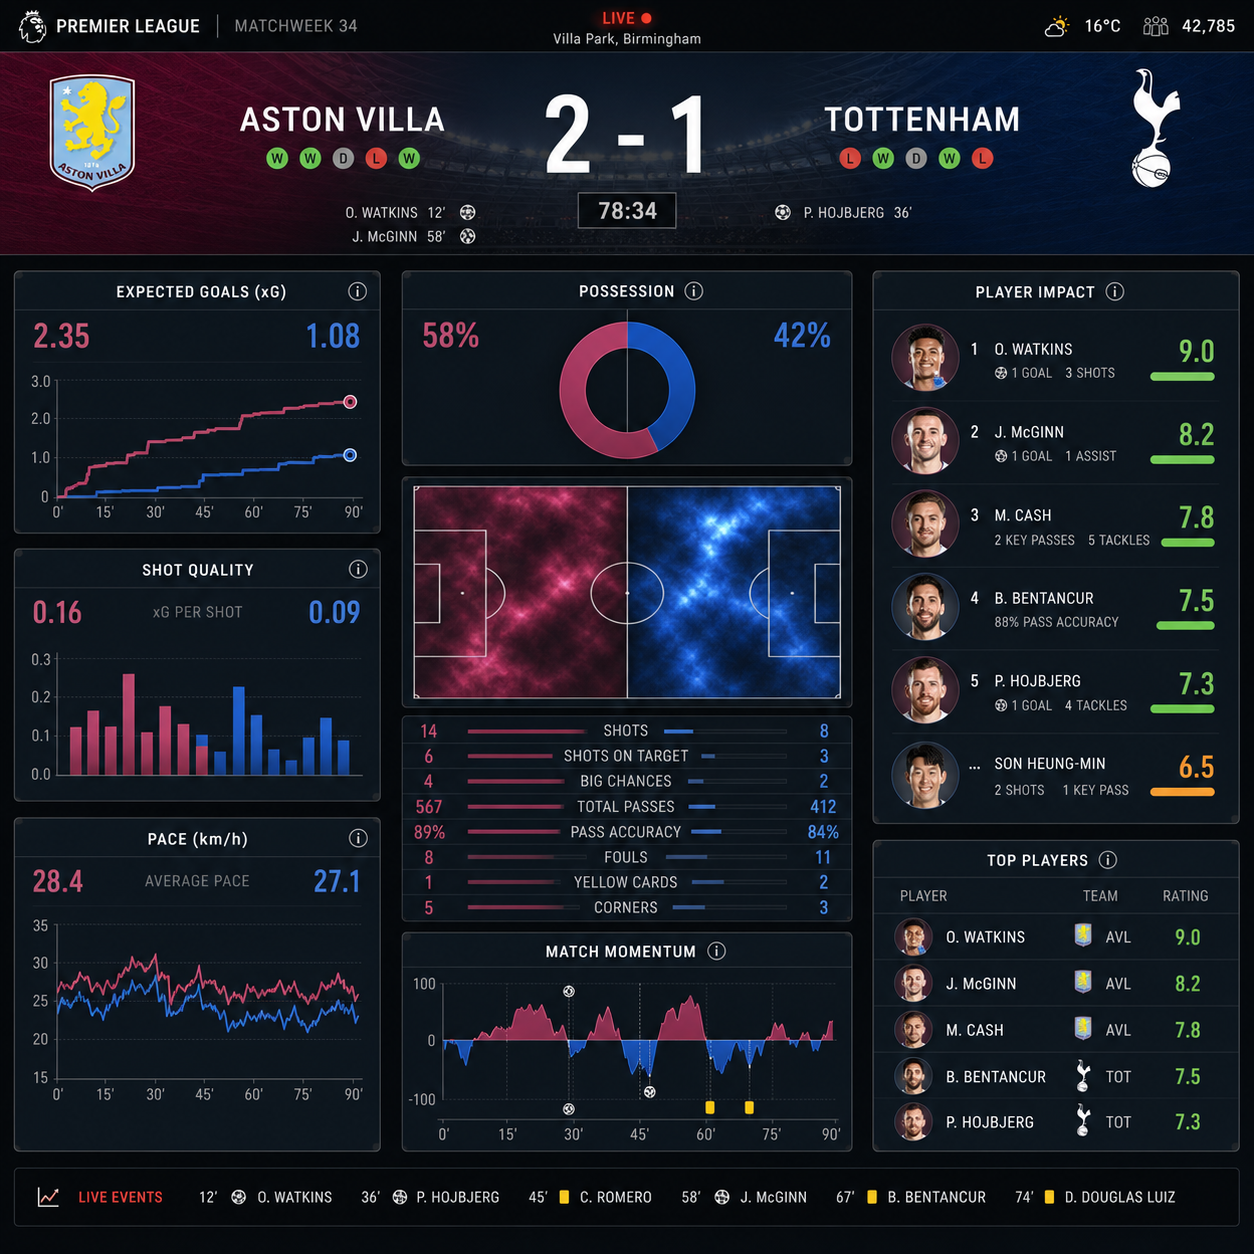
A scoreline tells you who is ahead, but it rarely explains why. A team can lead after one fortunate finish, trail despite creating better chances, or dominate possession without producing meaningful attacks.
For people who follow live sports scores, advanced statistics provide the missing context. They help connect match events with team performance, revealing control, efficiency, momentum, and individual contribution as a game develops.
Why the Scoreline Does Not Tell the Whole Story
The scoreline shows the current result, but advanced statistics show how that result was produced. They add evidence about chance quality, territorial control, defensive resistance, and whether a performance is likely to continue.
Consider a soccer match in which Team A leads 1–0 after 20 minutes. The basic result favors Team A, yet the wider match context may show that Team B has created several dangerous opportunities, forced saves, and consistently recovered the ball near the penalty area. The goal matters, but it may not describe the balance of play.
The same principle applies across sports:
- In basketball, a team may trail while generating efficient shots and losing points through turnovers.
- In baseball, a pitcher may allow a run after weak contact and an error rather than sustained offensive pressure.
- In American football, a team can gain fewer yards but remain competitive through red-zone efficiency and successful third-down plays.
Advanced data does not dispute the result. It explains the path to it. That distinction matters during a live game, when the score can remain unchanged even as pressure, momentum, and shot quality shift sharply.
The Difference Between Basic and Advanced Statistics
Basic statistics describe visible events, while advanced statistics interpret those events to estimate quality, efficiency, or contribution. Goals, points, shots, fouls, and possession are useful starting points; advanced metrics help explain their meaning.
A simple shot count, for example, treats a long-range attempt and a close-range chance as the same event. Shot quality separates them by considering factors such as location, angle, defensive pressure, and the type of attacking move that created the attempt.
Basic numbers answer questions such as:
- How many goals or points were scored?
- How many shots or attempts were taken?
- Which team had more possession?
- How many fouls, turnovers, or penalties occurred?
Advanced metrics ask deeper questions:
- How valuable was each chance?
- Did possession move the team closer to scoring?
- How efficiently did a player convert opportunities into useful actions?
- Did a defender prevent danger before it became a shot?
These measures are best treated as layers. The scoreline records the outcome, basic statistics describe activity, and advanced metrics evaluate the quality and consequences of that activity.
Key Advanced Metrics Explained
Advanced metrics quantify the quality of opportunities, the value of actions, the speed of play, and the effect of individual decisions. Their exact formulas vary by sport, so interpretation must always follow the sport and competition context.
Expected goals and shot quality
Expected goals, commonly written as xG, estimate how likely a shot is to become a goal based on comparable chances. A chance valued at 0.50 xG is generally considered more dangerous than one valued at 0.03 xG, although neither outcome is guaranteed.
xG is especially useful in soccer because goals are relatively rare and can be heavily influenced by deflections, rebounds, or exceptional finishing. Comparing a team’s goals with its expected goals can reveal whether it finished chances efficiently or benefited from unusually favorable outcomes.
Shot quality has related uses in basketball, hockey, and other sports. A basketball analysis might distinguish open three-point attempts from contested mid-range shots. Hockey models may account for shot location, rebound potential, and traffic in front of the net.
Possession value and efficiency
Possession measures control of the ball or puck, but possession value asks what a team did with that control. Ten safe passes in defense do not carry the same attacking value as a pass that breaks a defensive line or creates a scoring opportunity.
Efficiency measures output relative to opportunity. Examples include points per possession in basketball, conversion rate in soccer, yards per play in football, or runs created relative to plate appearances in baseball. Efficiency can expose the difference between volume and effectiveness.
Choosing a high-volume approach may create more chances, but it can also produce waste. A team that takes many low-quality shots may appear active while an opponent creates fewer, better opportunities.
Pace, tempo, and player impact
Pace and tempo describe how quickly a game or team operates. A fast tempo can increase possessions and scoring opportunities, but it may also create turnovers and defensive gaps. Slow play can reflect control, fatigue, a tactical plan, or a team protecting a lead.
Player impact metrics combine several actions to estimate how an individual affects team performance. Depending on the sport, this may include scoring, chance creation, defensive actions, rebounding, ball progression, passing effectiveness, or on-off team results.
No single player-impact number captures everything. A midfielder who prevents attacks through positioning may have modest attacking statistics but a major defensive influence. A basketball guard may create value through screens and passes that lead to assists several actions later.
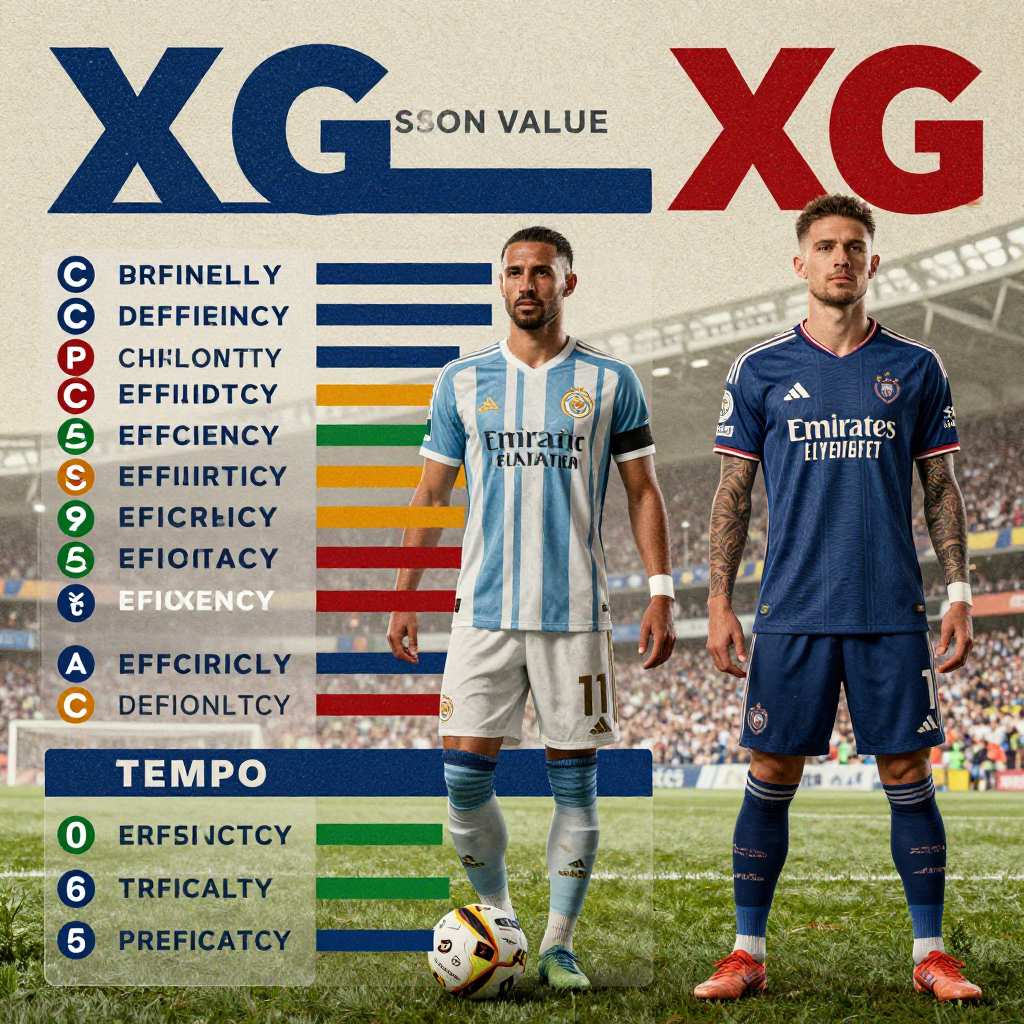
How to Read Statistics During a Live Game
To interpret statistics during a live game, start with the score and game state, then compare possession, chance quality, pressure, efficiency, and recent trends. Look for agreement among several indicators rather than relying on one number.
- Read the score in context. Note the time remaining, home advantage, red cards, injuries, foul trouble, pitching changes, or other events that alter strategy.
- Check the quality of chances. A team with fewer attempts may still lead in xG or another shot-quality measure.
- Separate possession from pressure. Identify whether possession reaches dangerous areas or stays harmlessly away from the scoring zone.
- Review the recent sequence. Last-five-minute trends often reveal momentum better than full-match totals, especially when the match has changed after a substitution or tactical adjustment.
- Test efficiency. Ask whether a team is converting opportunities at a sustainable rate or relying on an isolated breakthrough.
Live data requires caution because totals can lag behind events. A team may dominate the opening 30 minutes, concede against the run of play, and then change its approach. Once ahead, it may surrender possession deliberately and defend space. That lower possession figure does not automatically indicate poor performance.
For live sports scores, a useful mental model is state, pressure, quality, and sustainability: what is the score state, who has pressure, whose chances are better, and which pattern looks repeatable?
Using Advanced Statistics to Evaluate Players and Teams
Advanced statistics evaluate teams and players more accurately when they connect actions to role, opportunity, and match context. They should complement video, event data, and the scoreline rather than replace judgment.
For teams, examine four broad areas:
- Creation: chances created, progressive passes, entries into dangerous areas, or quality possessions.
- Prevention: pressures, blocks, interceptions, defensive rebounds, forced turnovers, and reduction of opponent shot quality.
- Efficiency: scoring or conversion relative to attempts and possessions.
- Consistency: whether the performance remains strong across different opponents, game states, and venues.
Player evaluation needs the same role-based approach. A striker should be assessed partly through shot volume, xG, movement, and finishing. A defender may contribute through positioning, recoveries, duel success, and the quality of attacks allowed. A playmaker’s value can appear in chance creation, passing effectiveness, and possession value even without a goal or assist.
Suppose a soccer winger completes fewer passes than usual but creates three high-quality chances and repeatedly carries the ball beyond the opposing fullback. Pass completion alone would underrate the performance. Conversely, a high passing percentage built mostly from safe passes may overstate influence.
Comparisons also require normalization. Per-game totals favor players who receive more minutes, while per-possession or per-minute rates can exaggerate small samples. The right measure depends on the question.
Common Mistakes When Interpreting Sports Data
The most common statistical mistakes involve ignoring sample size, game state, metric definitions, and the difference between activity and value. Advanced data becomes misleading when readers treat a single figure as a complete verdict.
Relying on one statistic
The error: Using possession, shots, or xG alone to declare which team played better.
Why it happens: One number is easy to compare, especially during a fast-moving live game.
Consequence: You may mistake harmless possession for control or overlook excellent defensive work.
Correction: Pair each headline statistic with at least one quality measure and one contextual measure.
Overreacting to a small sample
The error: Treating a player’s two shots or a team’s 15-minute spell as proof of a lasting trend.
Why it happens: Live statistics update quickly and create a strong impression of momentum.
Consequence: Random events, rebounds, or one unusual finish receive too much weight.
Correction: Compare the current spell with longer-term performance and wait for repeated evidence.
Misreading possession and score effects
The error: Assuming the team with more possession is always superior.
Why it happens: Possession looks like a direct measure of dominance.
Consequence: A leading team that defends a result can appear weaker after intentionally giving up the ball.
Correction: Interpret possession alongside territory, chance quality, tempo, and the score state.
Comparing unlike metrics across sports
The error: Treating xG, points per possession, and baseball expected statistics as interchangeable proof of performance.
Why it happens: The word expected suggests a universal formula.
Consequence: Important differences in event frequency, scoring systems, and model design disappear.
Correction: Learn what the metric estimates within its sport before comparing it with another statistic.
Building a More Complete Match Picture
To build a complete match picture, combine the scoreline, key events, advanced metrics, and tactical context in a fixed order. This prevents one dramatic goal or statistical spike from dominating the analysis.
- Outcome: Record the score, time, period, and remaining opportunities.
- Events: Note goals, points, cards, substitutions, injuries, turnovers, penalties, and changes in personnel.
- Volume: Review shots, possessions, attacks, passes, rebounds, or other activity measures.
- Quality: Examine xG, shot quality, possession value, field position, or comparable advanced metrics.
- Efficiency: Compare output with opportunity to identify finishing, shooting, or conversion differences.
- Context: Account for tactics, fatigue, venue, opponent strength, and whether the score changed each team’s incentives.
This framework produces better questions. Instead of asking only, “Who is winning?” ask, “Who is creating the better opportunities, who is controlling valuable space, and what has changed since the last major event?”
Advanced statistics can improve live analysis and post-match evaluation, but they cannot guarantee the final result. A low-probability chance can still become a goal, and a dominant team can fail to convert. The scoreline remains the official outcome; advanced metrics explain the performance behind it.
Frequently Asked Questions
What are advanced sports statistics?
Advanced sports statistics are measures that estimate the quality, value, or efficiency of actions rather than simply counting events. Examples include expected goals, possession value, points per possession, and player-impact measures.
Why is the scoreline not enough to judge performance?
The scoreline records the result but may hide chance quality, defensive resilience, tactical changes, and efficiency. A team can win while being outplayed for long periods or lose after creating better opportunities.
What does expected goals mean?
Expected goals, or xG, estimate the probability that a scoring chance will become a goal. The estimate reflects characteristics of the chance, but it does not predict the outcome of any individual shot.
Which statistics are most useful during a live game?
The most useful combination usually includes the score state, recent pressure, chance quality, possession or territory, and efficiency. The best metrics vary by sport and should be interpreted with time remaining and major match events.
Can advanced metrics predict the final result?
Advanced metrics can describe which team has produced stronger underlying performance, but they cannot guarantee a result. Random events, player decisions, injuries, officiating calls, and late tactical changes can all alter the final score.